Home > Azure > Adding Analytics
When needing to analyze data, its often worth having a quick look after suitable BI-tools instead of implementing a custom application. In this section we’ll visualize speedtests using Time Series Insights.
Preparing the Event Hub
Before we can connect Time Series Insights to our Event Hub, we need to add a new consumer group and a new access policy.
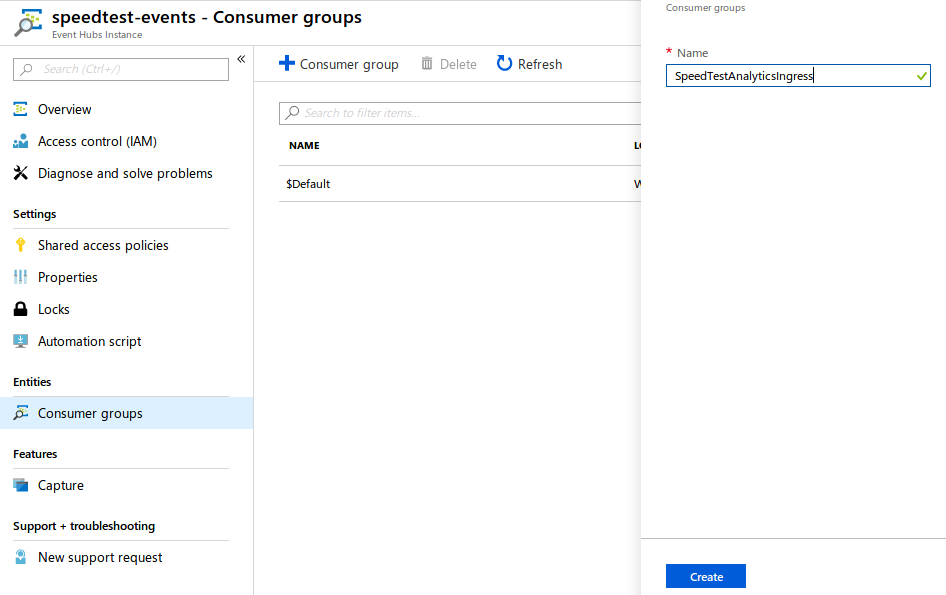
Open speedtest-events and add a new consumer group named SpeedTestAnalyticsIngress. In essence, we’re telling event hub that there’s going to be an application/consumer that’ll need it’s own view of the events we’re publishing.
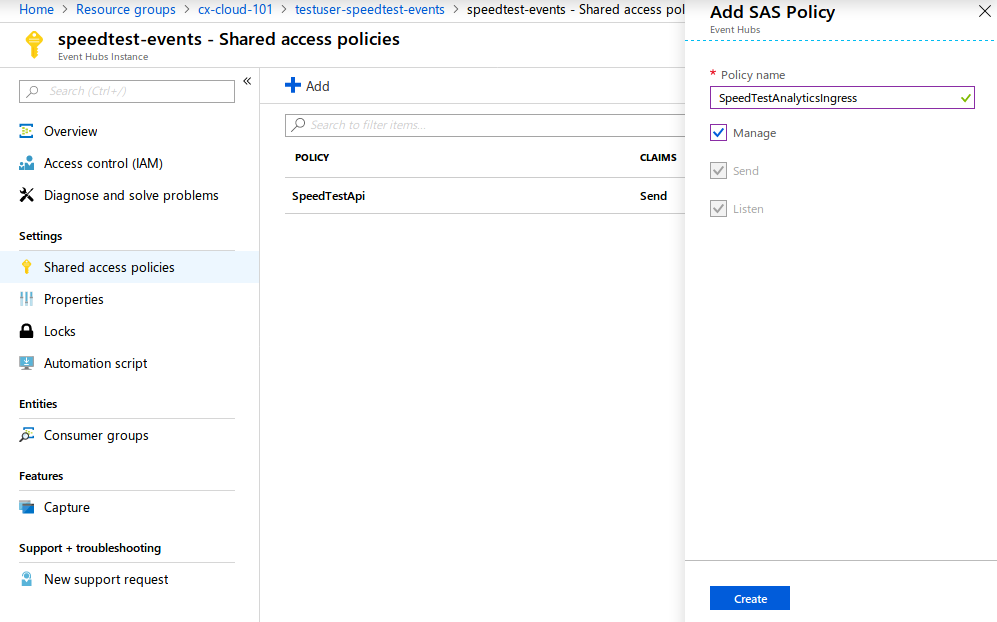
We should also create a new access policy named SpeedTestAnalyticsIngress for our new Time Series Insights application.
Creating Time Series Insights
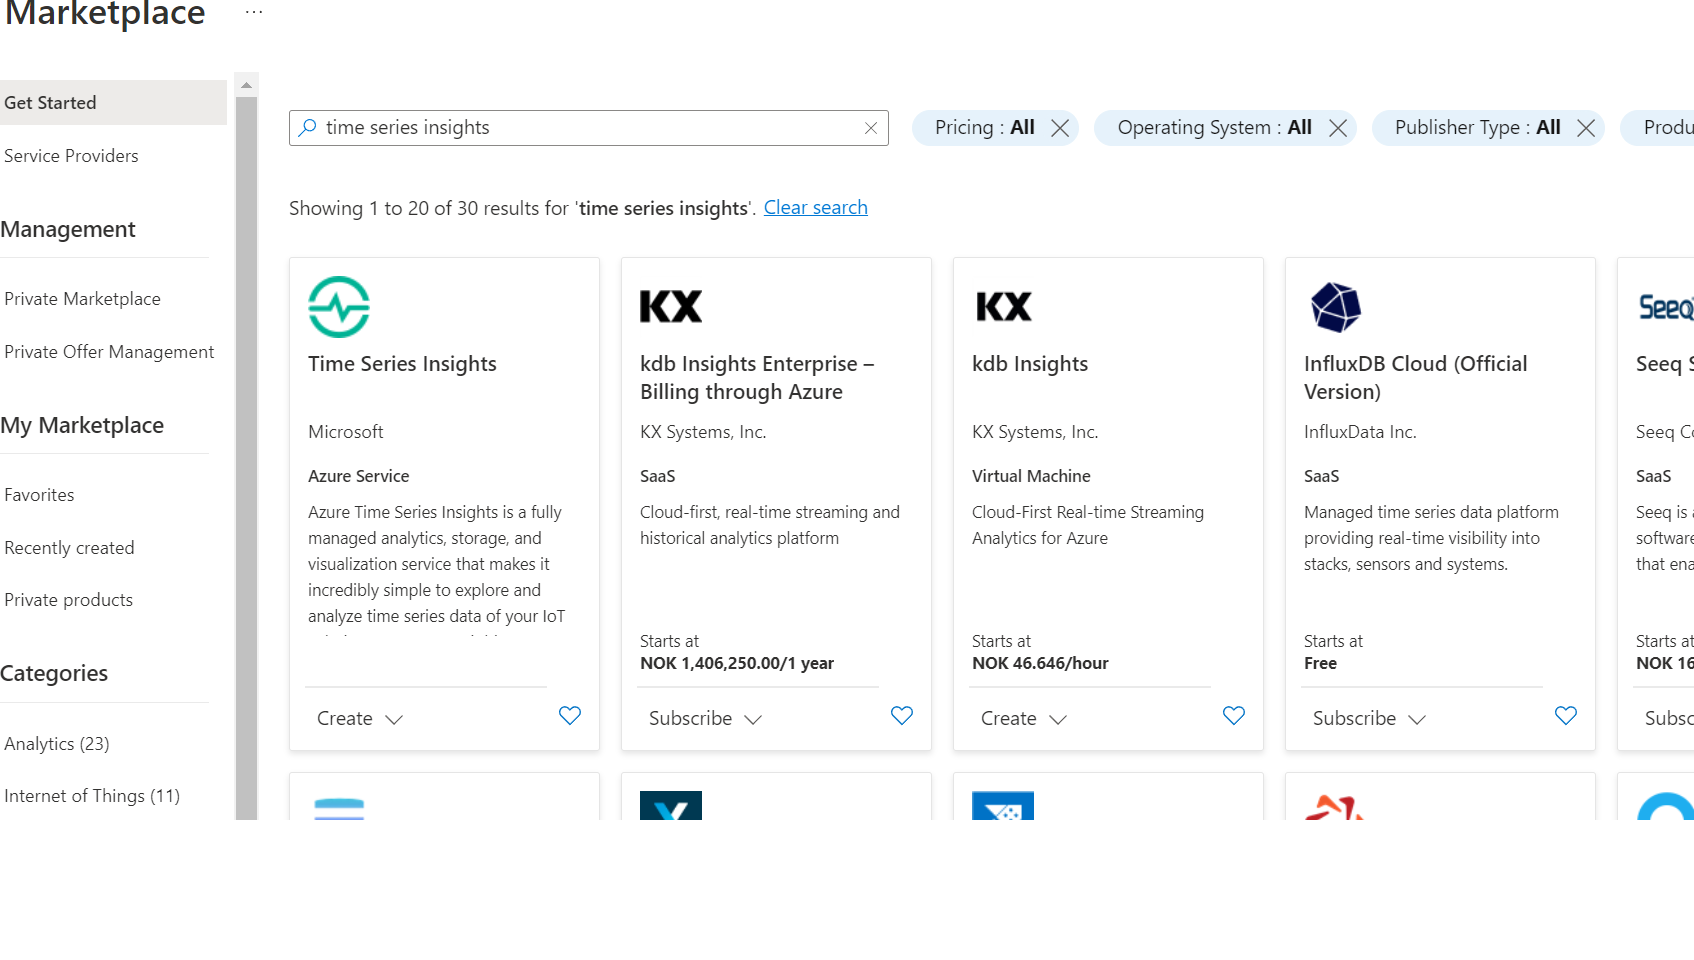
With all that out of the way, navigate to the cx-cloud-101 resource group, and add a new “Time Series Insights” resource.
Name the environment speedtest-analytics and use the existing resource group cx-cloud-101. Set Time series ID property name to User (this is the property we use to group the time series). Finally create a new storageaccount.

Click on “Next: Event Source”. Change “Source type” to “Event Hub” and configure an event source using your existing Event Hub. Use the access policy and consumer group you just created, and use Timestamp as the timestamp property name (casing is important!). Finally click on “Review + create” and “Create”.
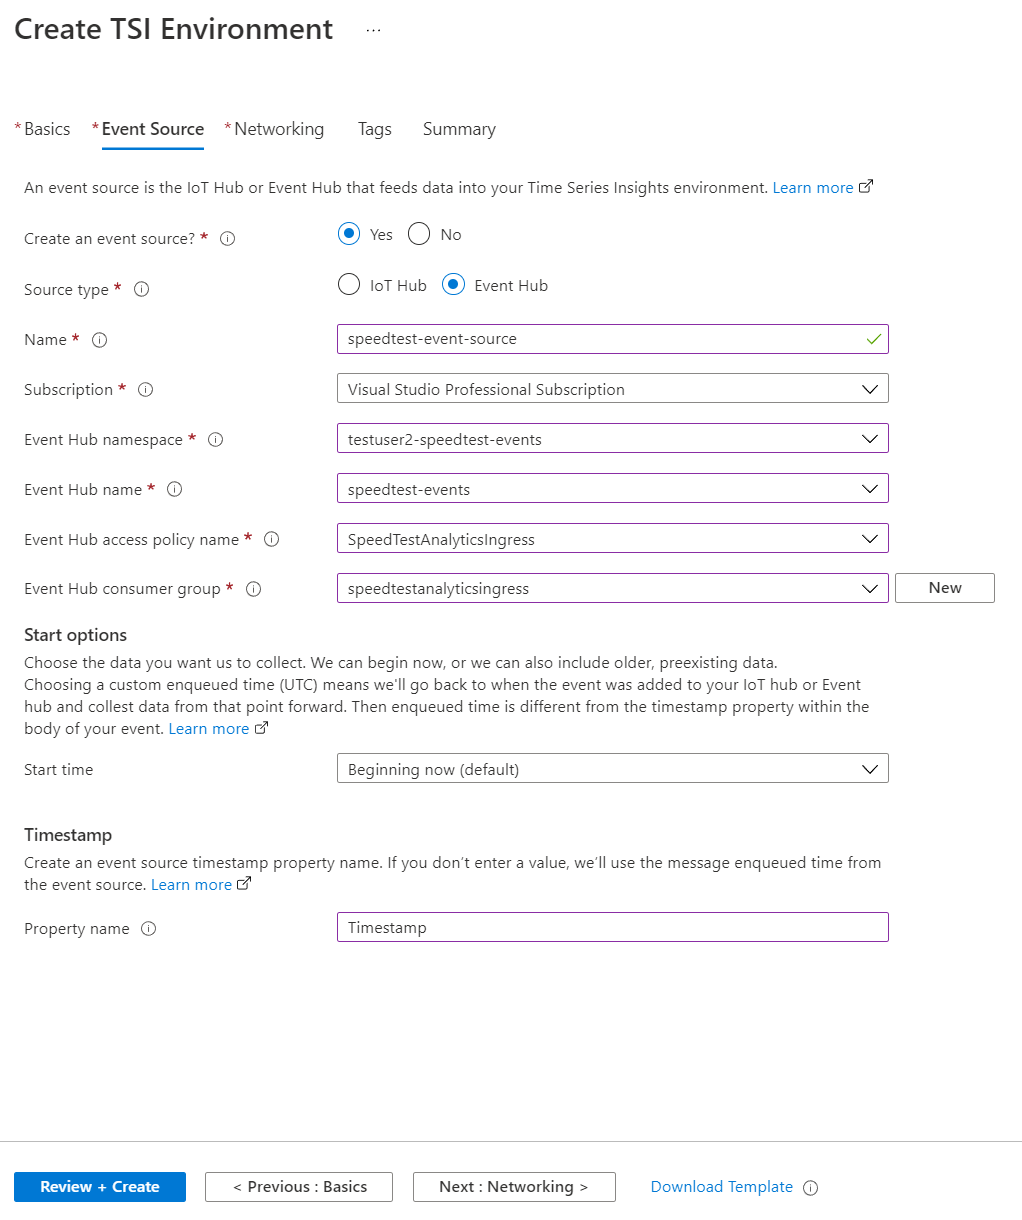
Why are we using Timestamp as the timestamp property name? Time Series Insights wants to know when the speedtests where recorded, and we have stored that information in a property called timestamp within TestResult.
Finally we can go to the overview page and open the Time Series Insights environment.
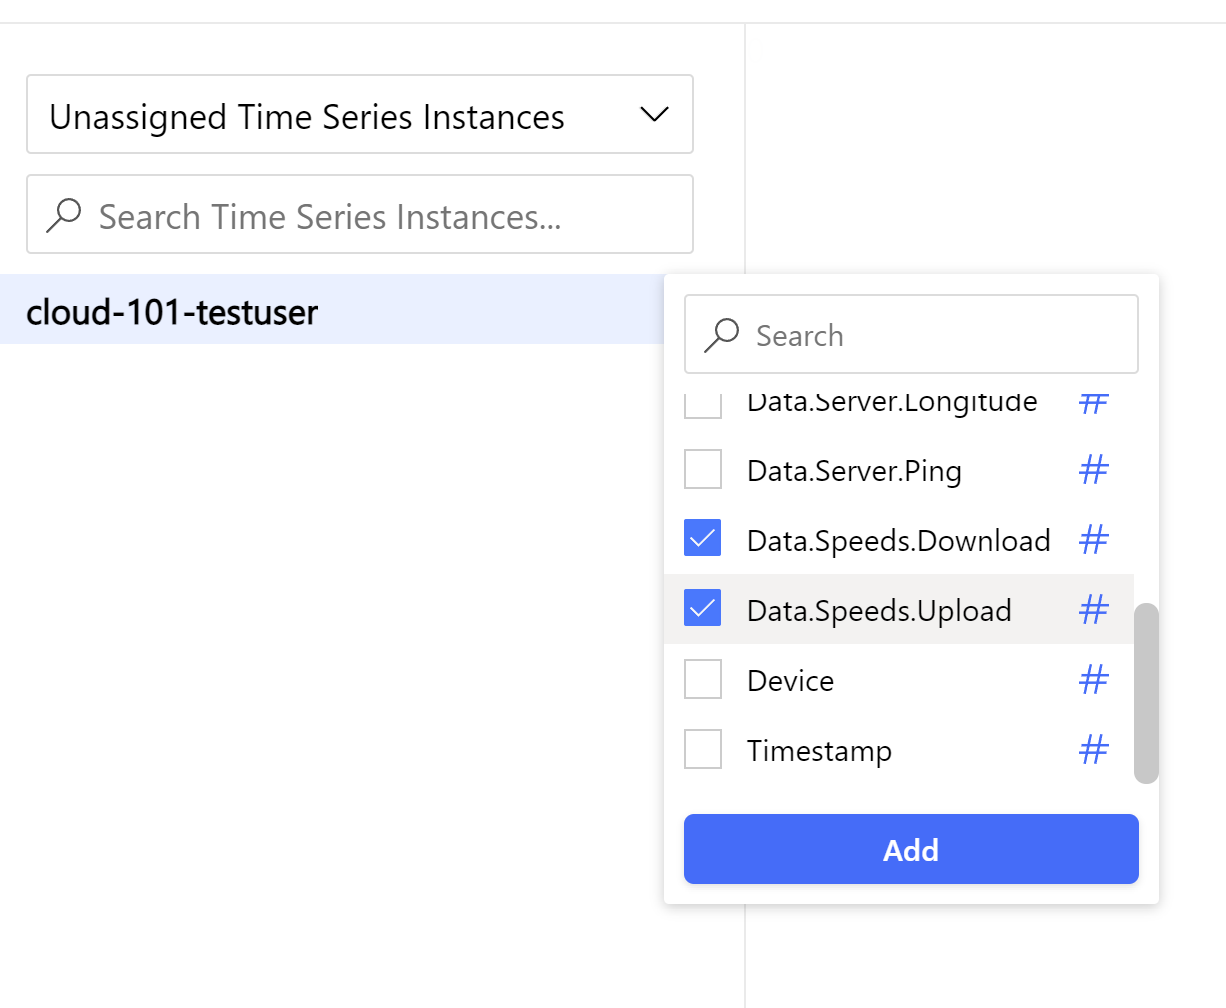
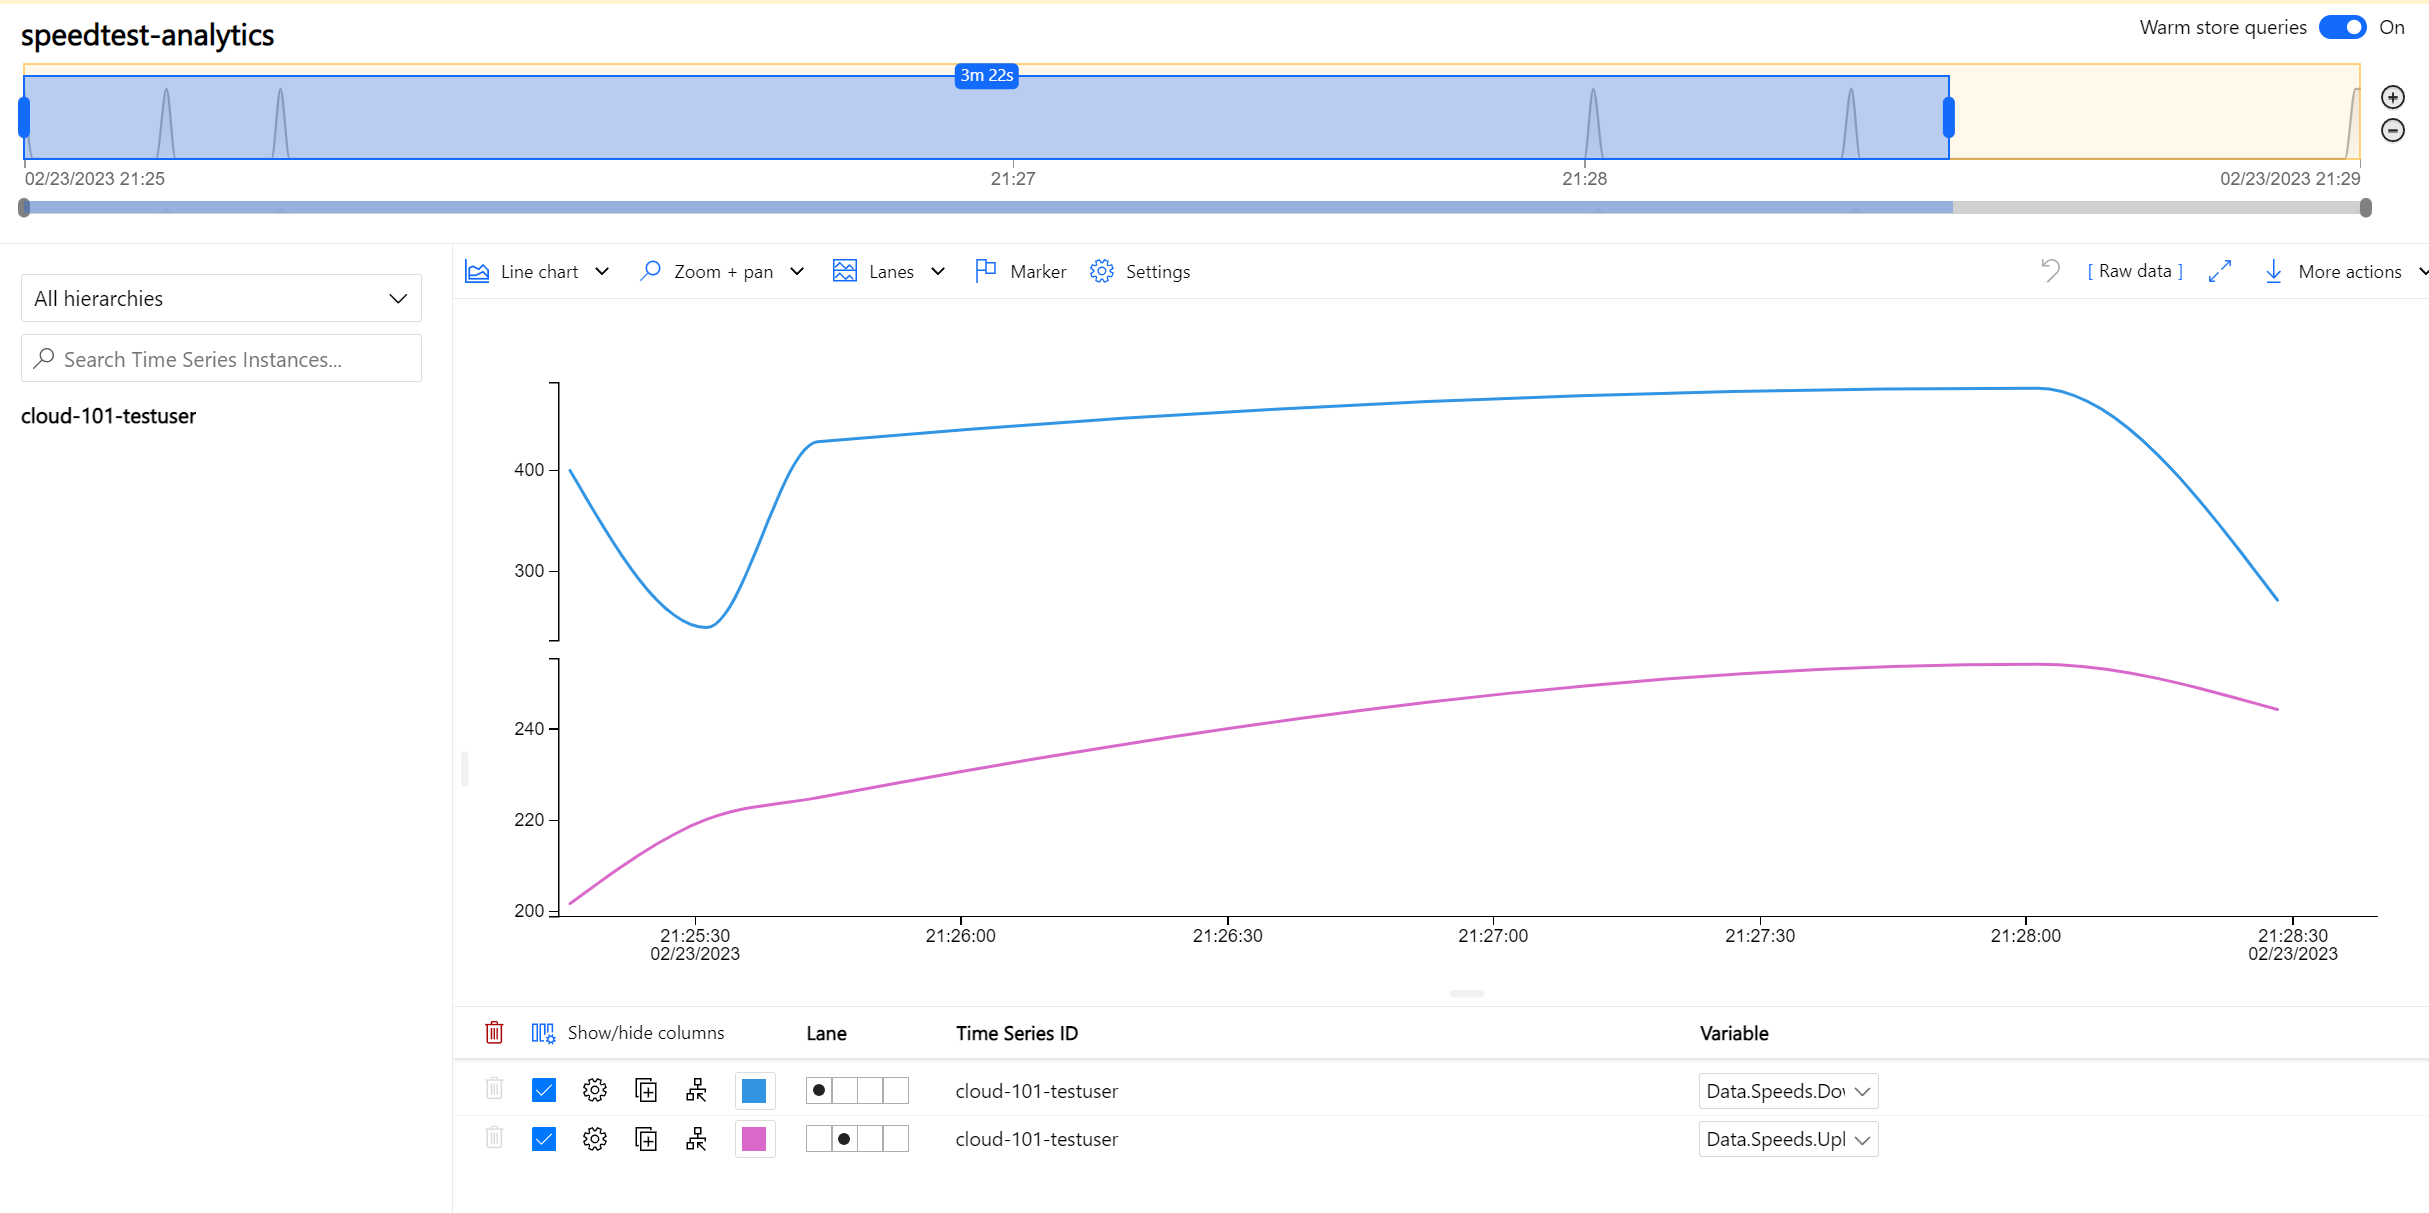
Inside Time Series Insights we can view different properties/measures, grouped by User. Choose your user, and try to view Download and Upload spped.
We can also mark an area in the graph and view all events related to that section. Run SpeedTestLogger a couple more times, so you get more data, and play around with the data in Time Series Insights. Explore the data in different ways. Can you create any interesting graphs?
Celebration time!
You’ve now made a completed system for measuring, logging, receiving, storing and analyzing internet speed on Azure. Congratulations!
Fom here on out, you have several options for what to continue with:
- Would you like to be able to schedule and trigger SpeedTestLogger from Azure, and learn about Service Bus and Logic Apps?
- Would you like to turn Console.WriteLine() into proper logging with Application Insights?
- Would you like to add another consumer-application, store data in Table Storage, and view them in a webapplication?